Introduction
After having mapped what you needed to measure you can open the Viewer application.
You'll first be able to import your data to visualize them.
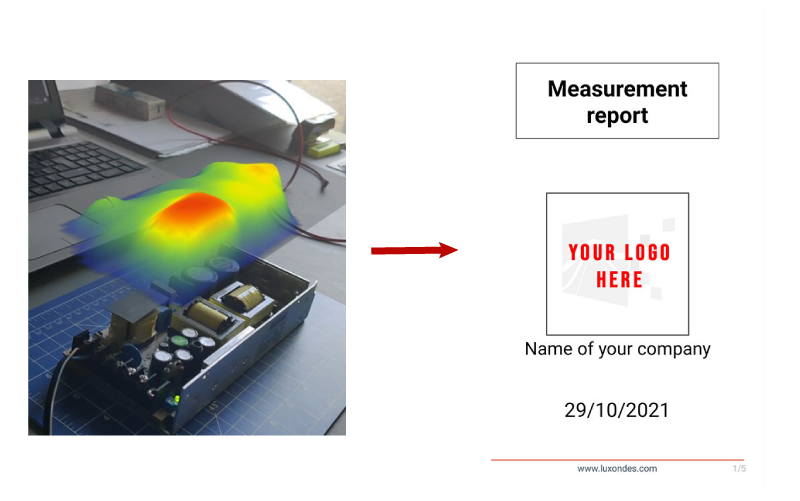
However its function isn't limited to a simple viewer, it allows you to export your datas in a PDF format and get an effective measurement report. On this report you can manage to get the frequency peaks of your measures and visualize where they come from for exemple.