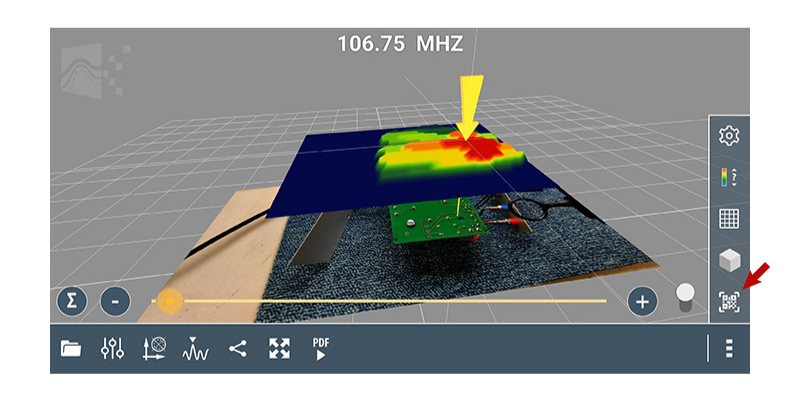
Introduction
You'll first be able to import your data to visualize them.
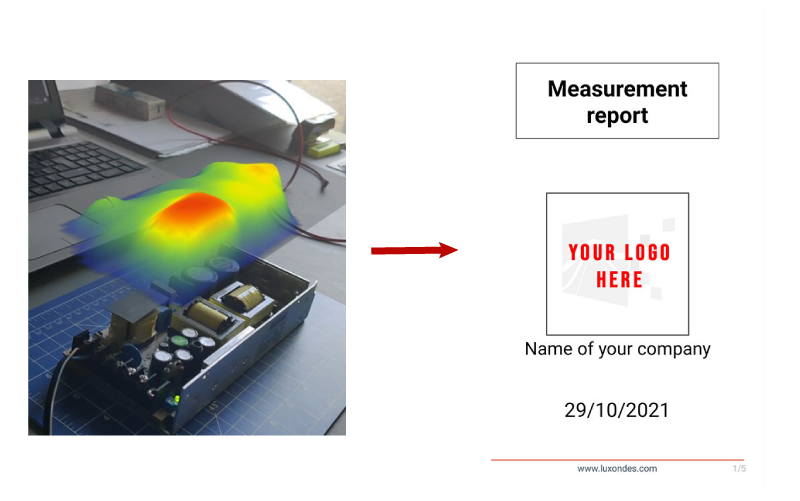
However its function isn't limited to a simple viewer, it allows you to export your datas in a PDF format and get an effective measurement report. On this report you can manage to get the frequency peaks of your measures and visualize where they come from for exemple.
Datas format
Now that you've done your measures you can manage to view them by following simple steps
1. Click on the folder symbol
2. Click on the " + " on Data 1 or 2
3. Select the file you've measured and which you want to analyse
LXD = ZIP = XML + JPG + DAT
The .lxd file contains 3 types of files : .xml .jpg and .dat which are described under
How to unzip the LXD file ?
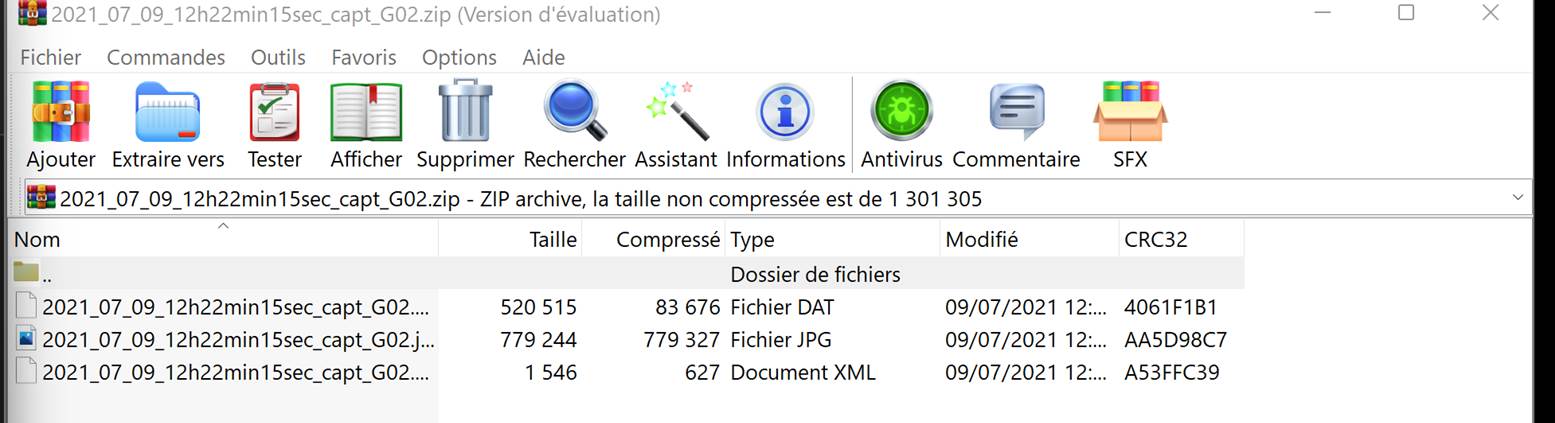
1 - Put the LXD file on your PC
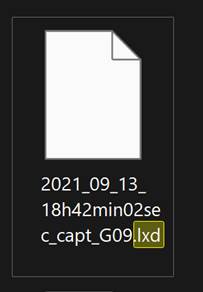
2 - Rename it (You have to replace .LXD by .ZIP)
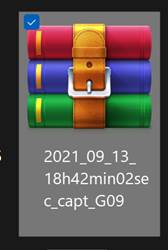
3 - Unzip and put the 3 files in a dedicated directory that you can create. The .XML file is inside
XML Format
1. XML norm in NFS (Near Field Scan)
Near-field scan measurements and simulations generate a large amount of data. The format of the data is closely linked to the supplier of the acquisition or simulation software, rendering extremely difficult its exchange between suppliers, customers, EDA tool vendors, academics, etc.
The XML / NFS (Near Field Scan) standard: TR 61967-1-1 © IEC: 2010 will define a universal exchange format for data from different near-field scanners . Its format is suitable for different 2D or 3D coordinate systems for a frequency or time domain.
If needed you can get more informations here : https://ieeexplore.ieee.org/document/5284701
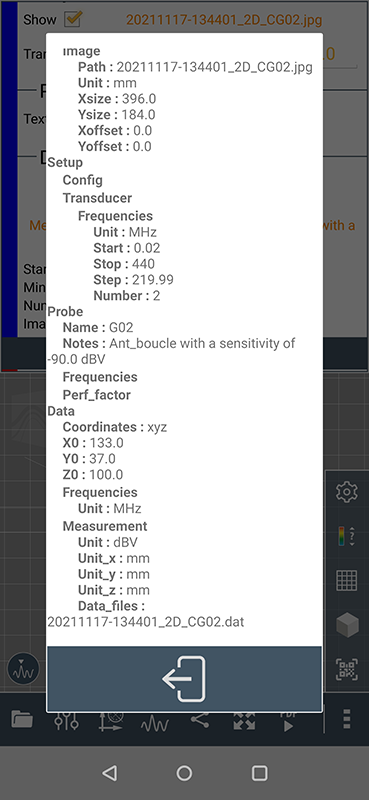
2. Measurement informations in text-based format.
 |
|
3. Example : Emission comparison between a power supply with and without cover using .xml datas
DAT Format
Measurement informations in a binary text file, the .dat gives a planar representation (x,y,z axis) and frequency information
OBJ + FFS
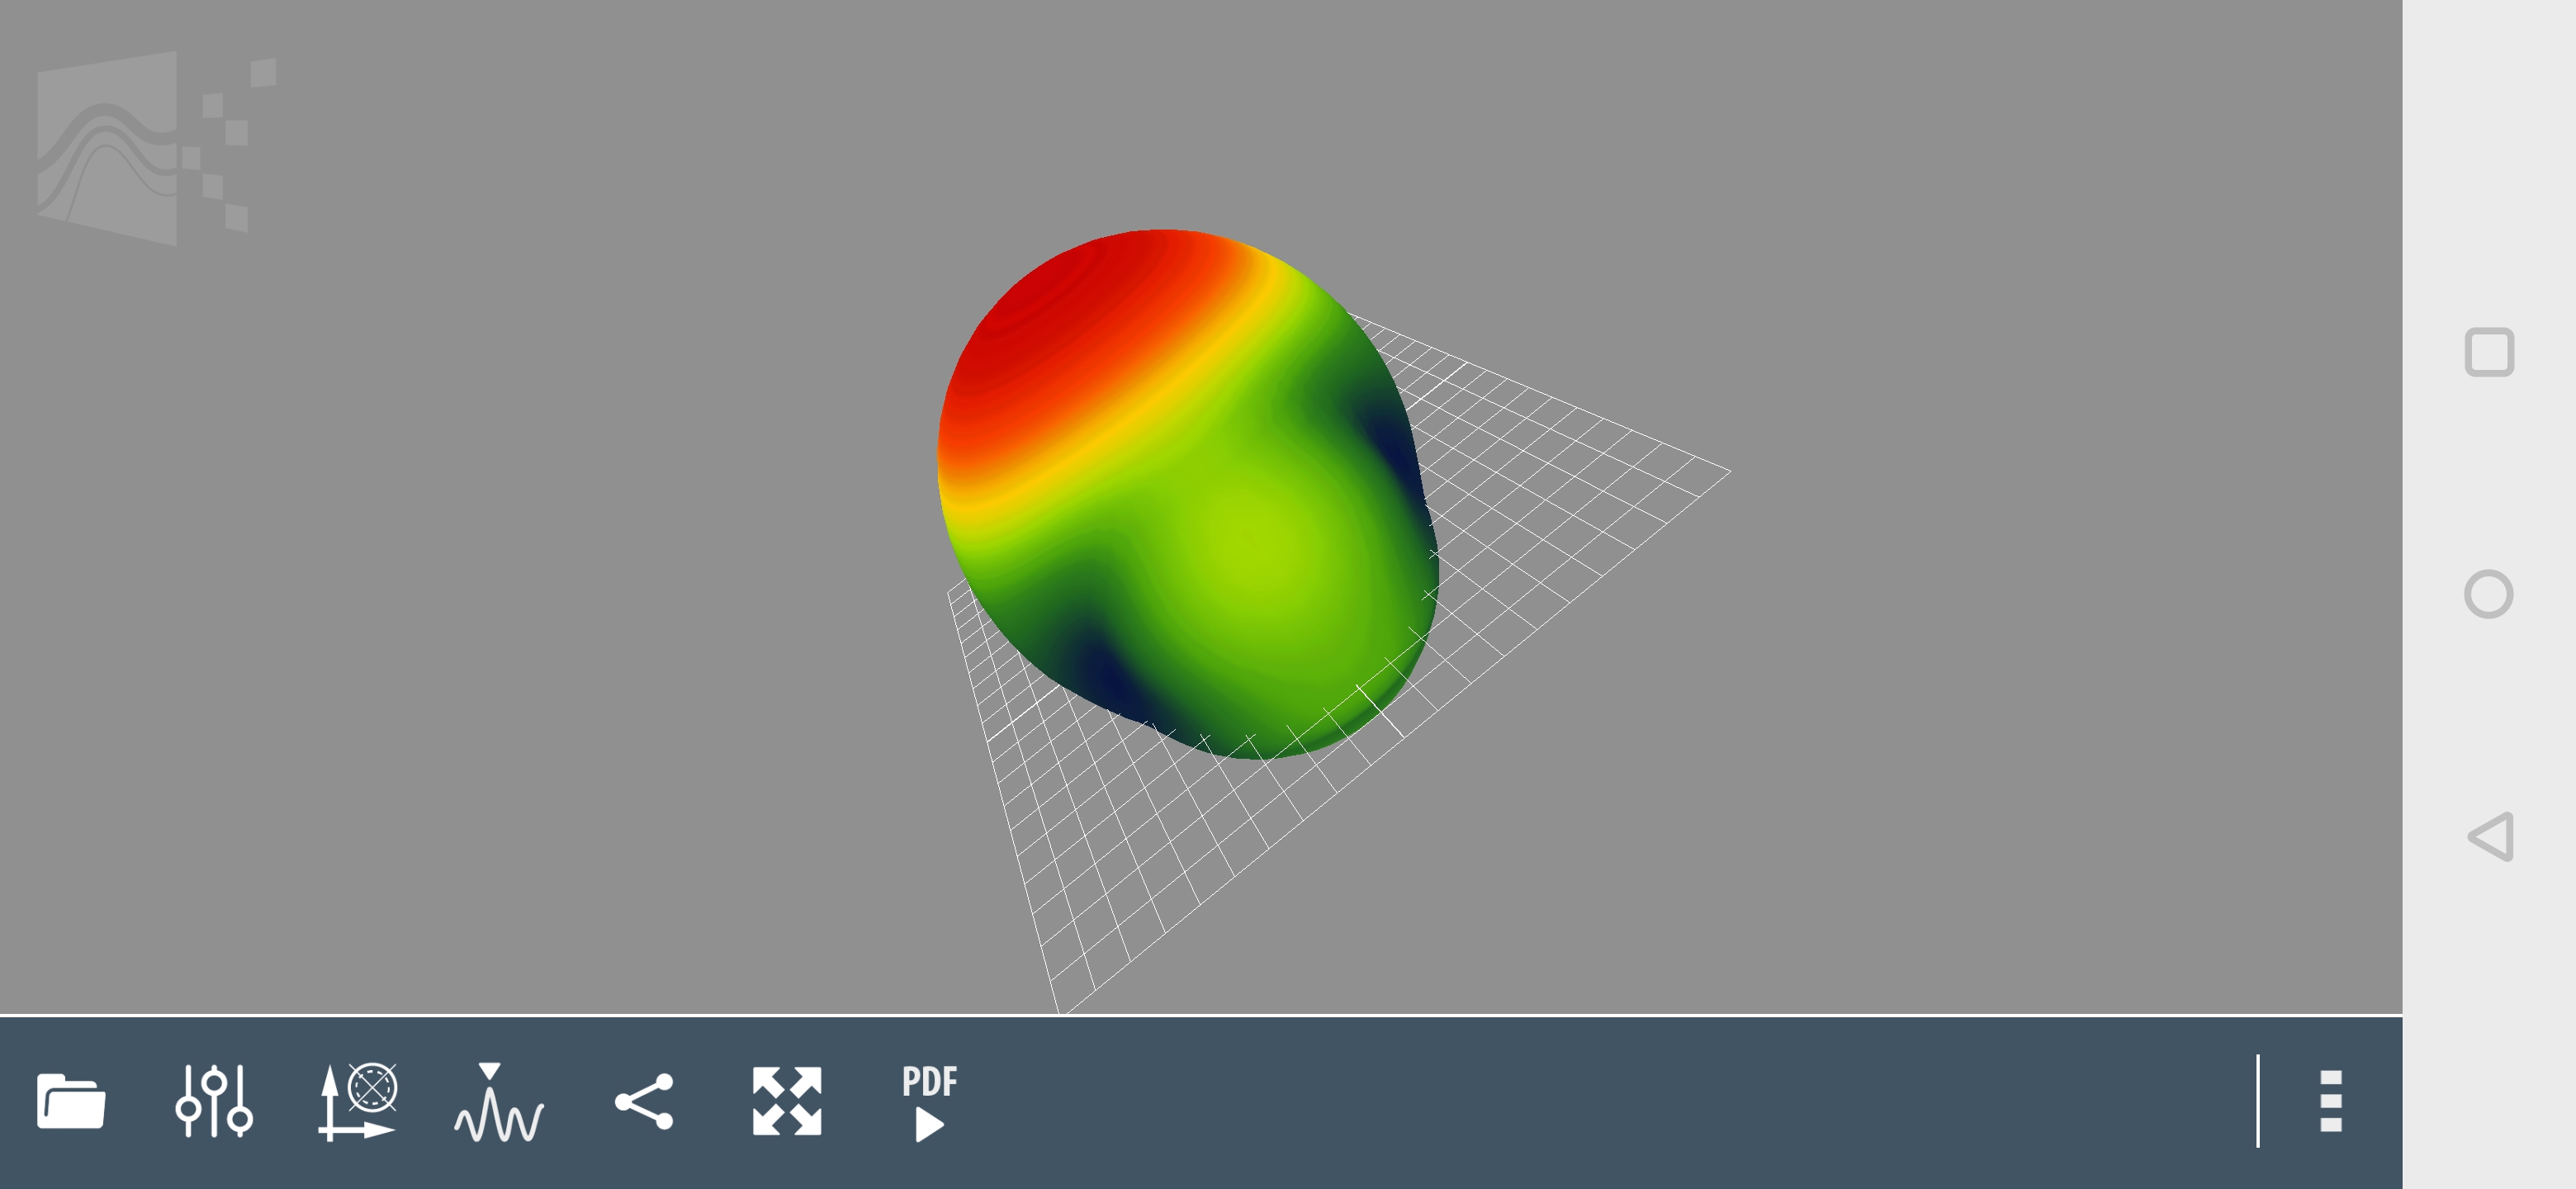
- FFS format : FarField Source : Corresponds to a simulation and comes from CST Studio http://www.mweda.com/cst/cst2013/mergedProjects/CST_CABLE_STUDIO/special_solvopt/special_solvopt_farfield_source.htm
- OBJ format : Object representation in 3D (SketchUp, 3DMax...)
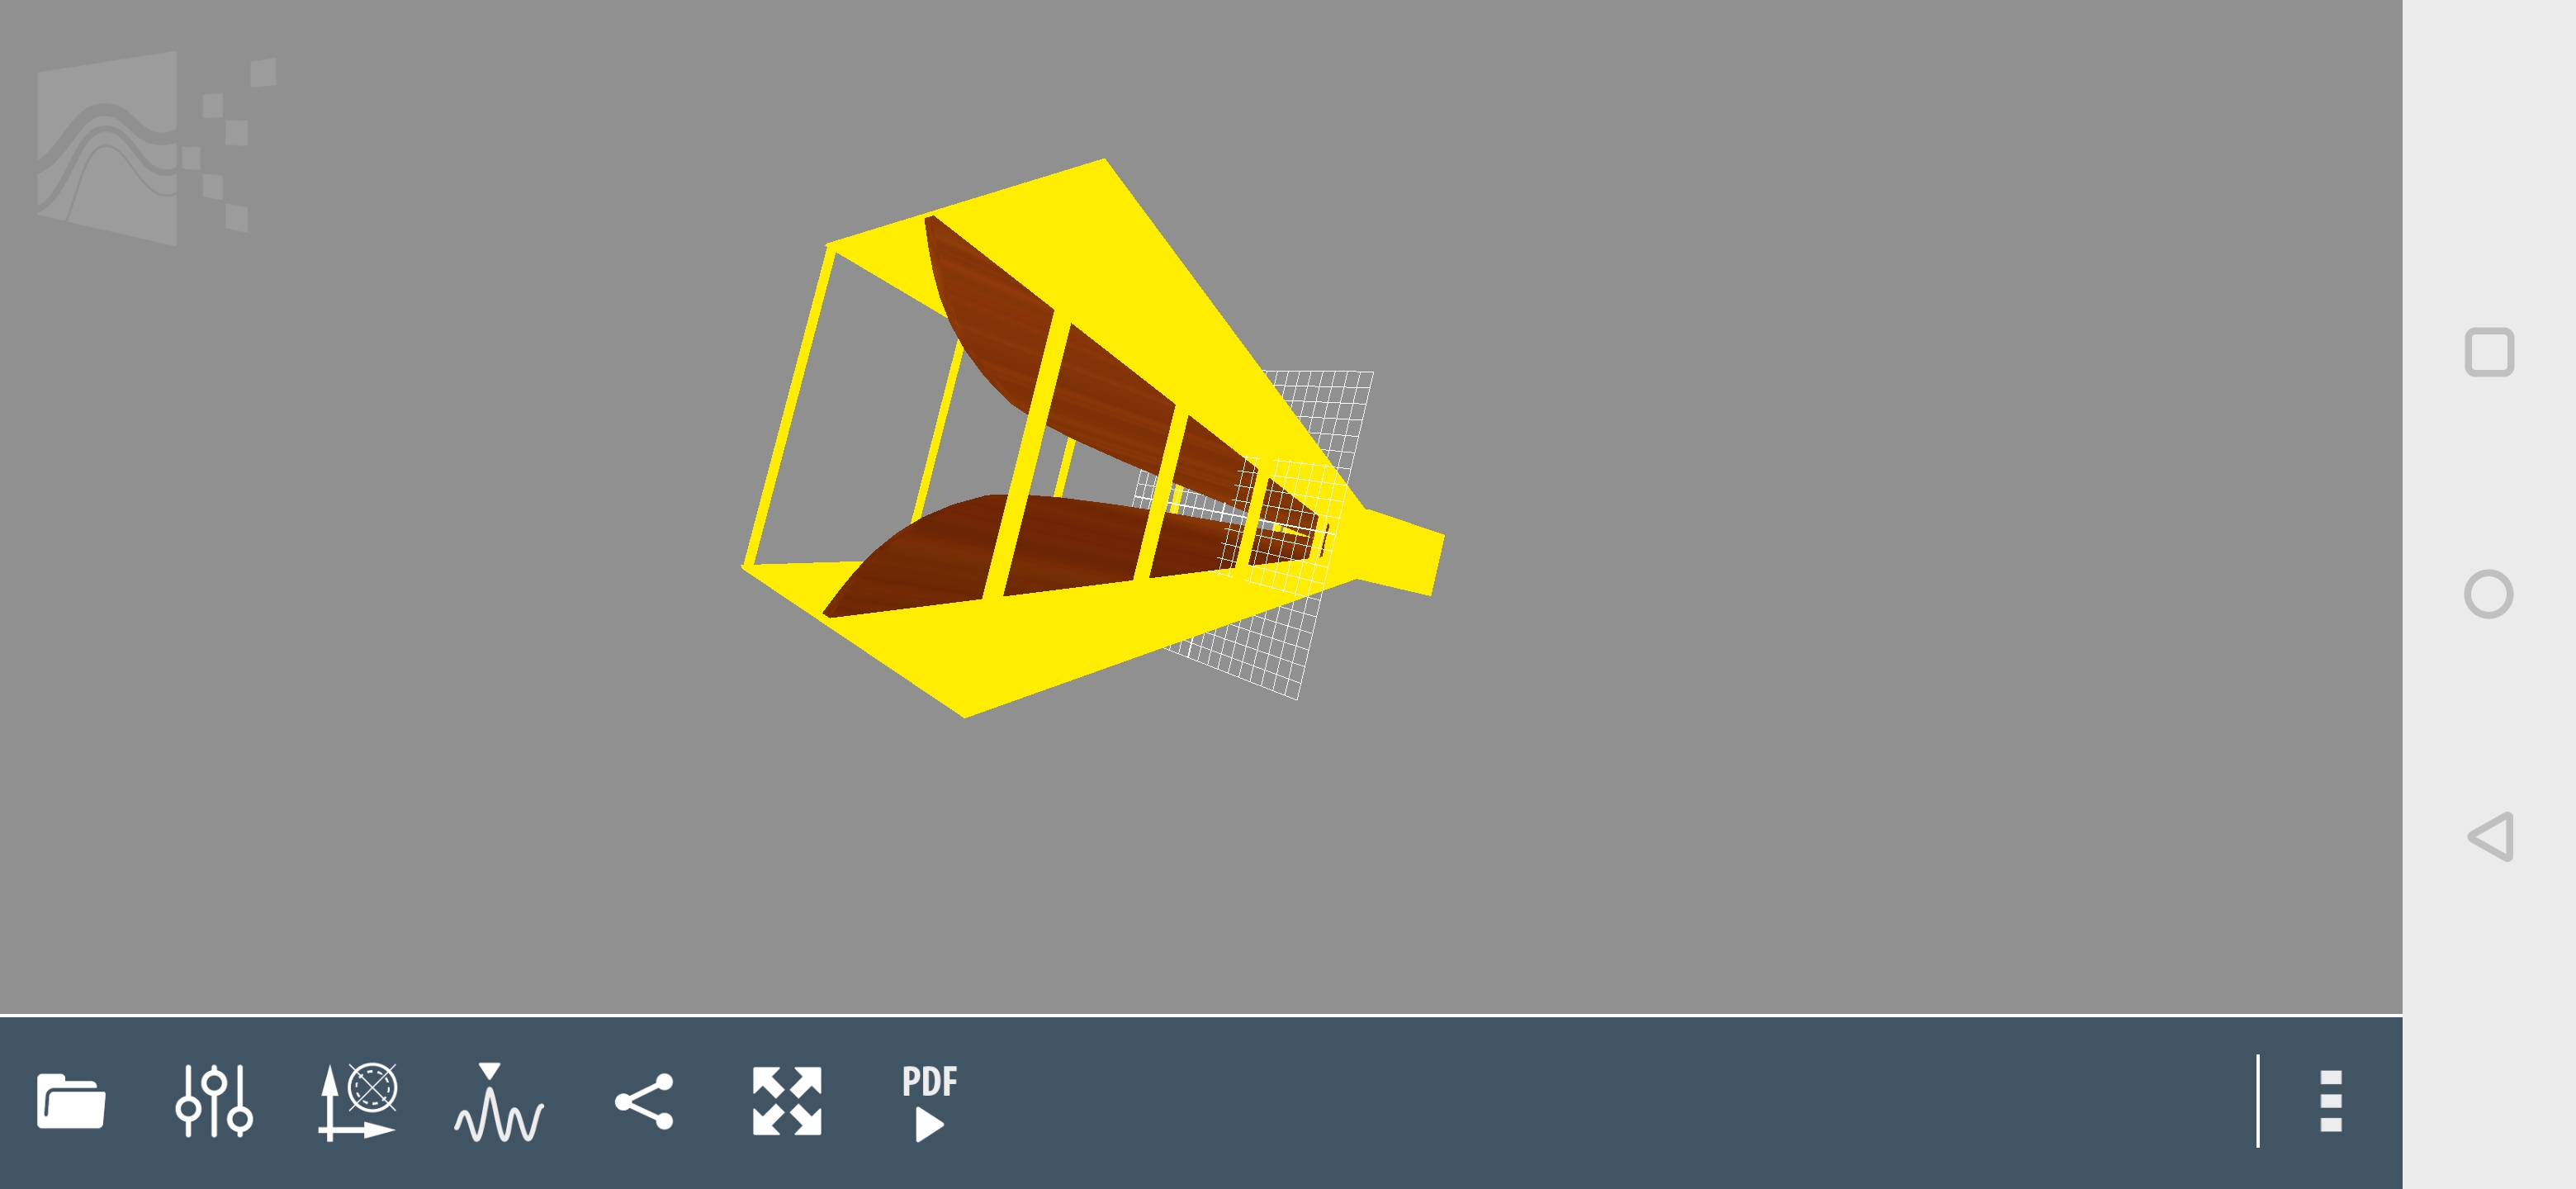
Example : Horn antenna simulation with its emission
Options
Transparency adjustment
By opening the 2nd tab you'll be able to custom the transparency of the measures. It can be useful to put into evidence where the waves are coming from.
Another way to set the transparency is available while using the frequency option of the EM-ScanPhone, simply slide that small tab
Color choice
Changes the color scale.
Graphs
Max and Frequency information
In this menu you get an additionnal frequency information, it allows you to see the amplitude measured corresponding to each frequency.
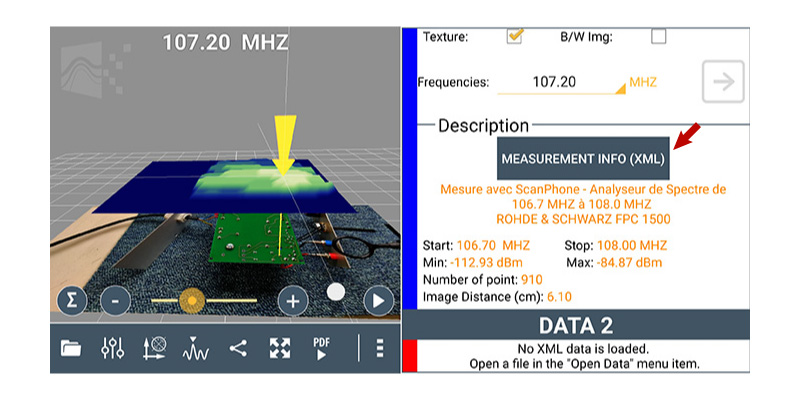
Measurement informations
Export the measurement datas in XML. format
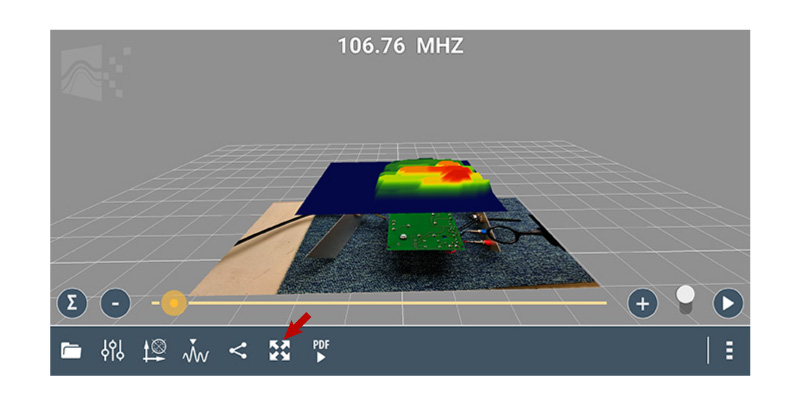
Default view
Reverts to the original point of view, useful to take screenshots from other angles
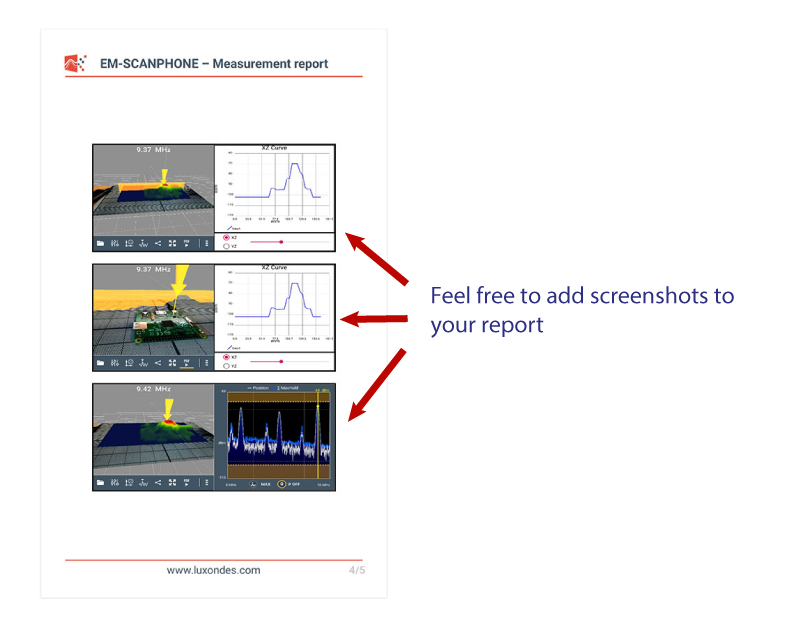
How to add screenshots to the PDF report
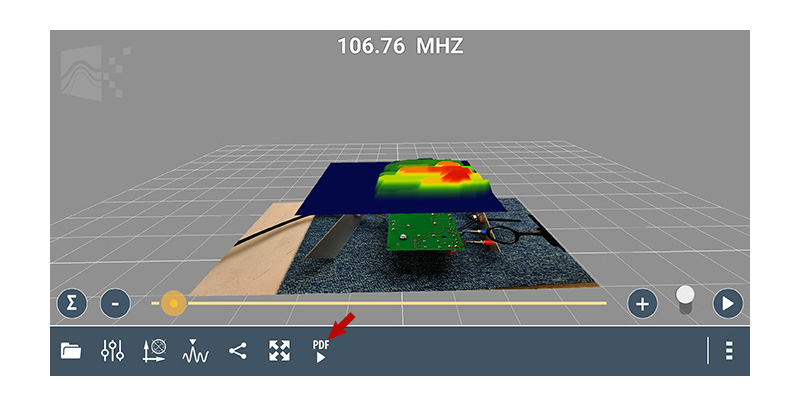
This allows you to take screenshot and add them automatically to your report.
PDF Measurement report
Full demonstration of a PDF Measurement report
PDF Export
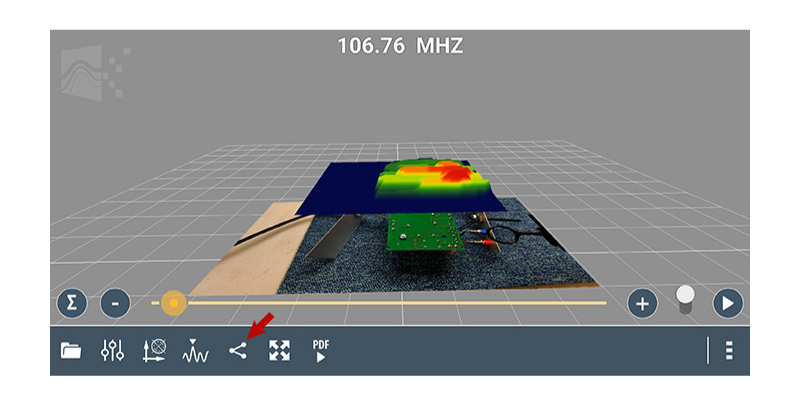
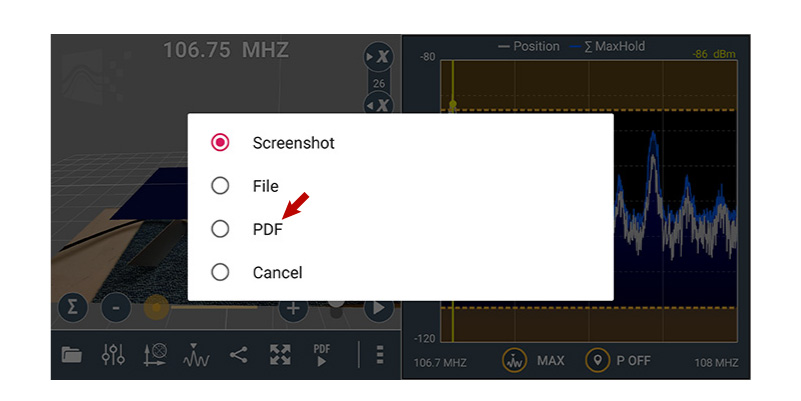
With the viewer app you can export your data into a pdf report quickly and easily. Allowing you to have the important informations about your measure within reach.
How to add your company logo and name to the report
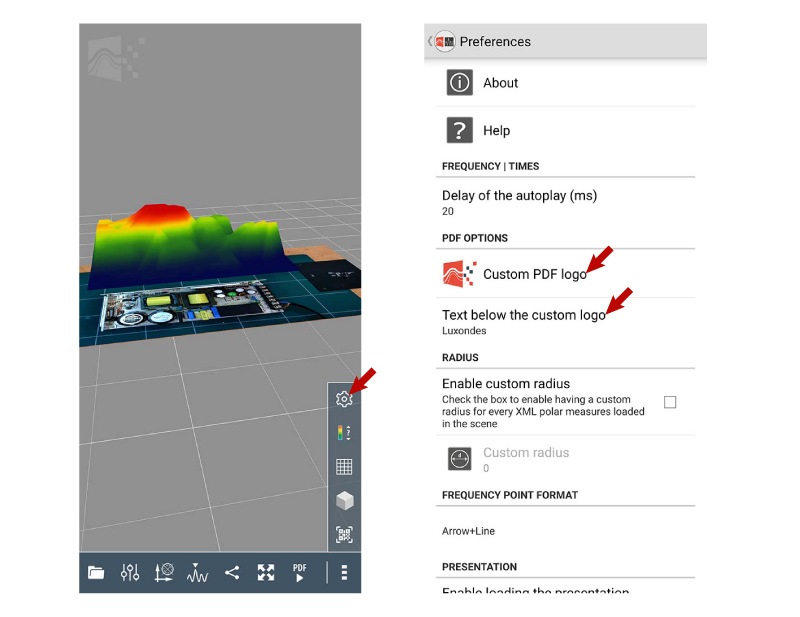
Setup informations
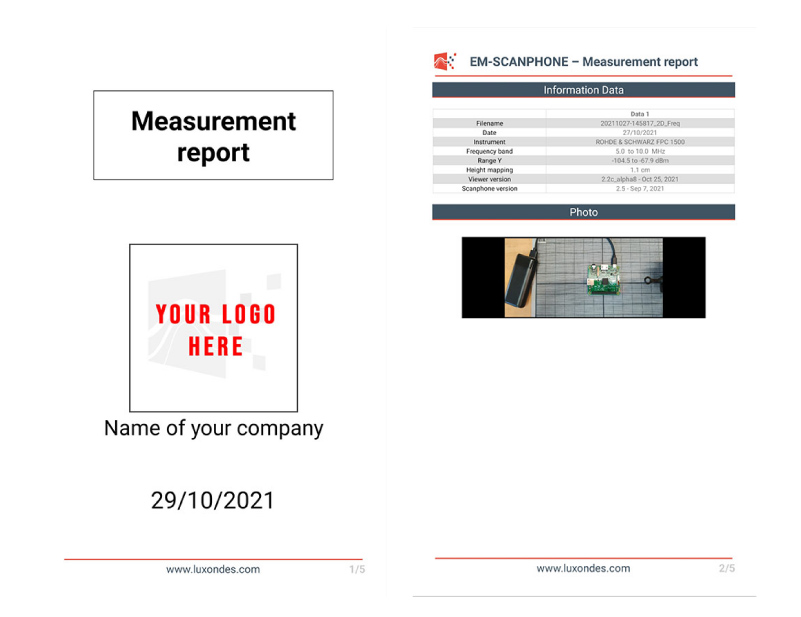
Measurement datas
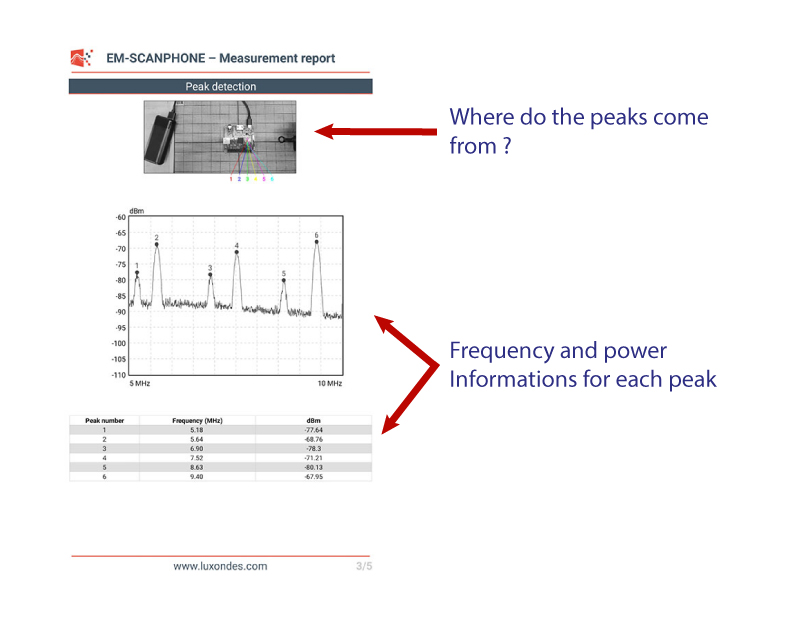
Screenshot examples
QRCode function
With the QRCode function of the viewer you can download mapping examples
Some are available here : https://www.luxondes.com/an_support/