Options
Transparency adjustment
By opening the 2nd tab you'll be able to custom the transparency of the measures. It can be useful to put into evidence where the waves are coming from.
Another way to set the transparency is available while using the frequency option of the EM-ScanPhone, simply slide that small tab
Color choice
Changes the color scale.
Graphs
Max and Frequency information
In this menu you get an additionnal frequency information, it allows you to see the amplitude measured corresponding to each frequency.
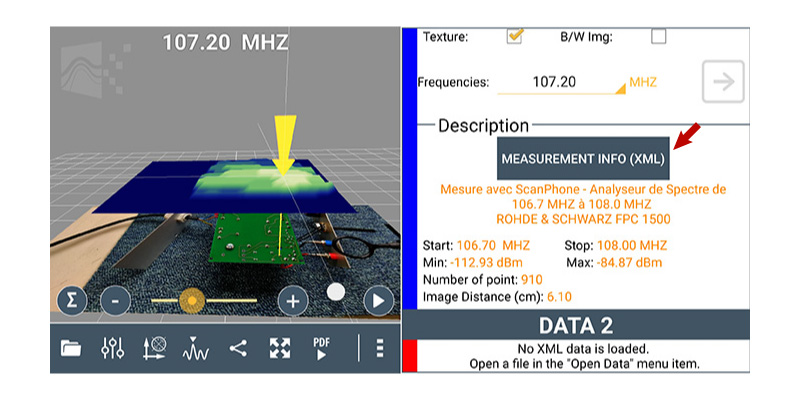
Measurement informations
Export the measurement datas in XML. format
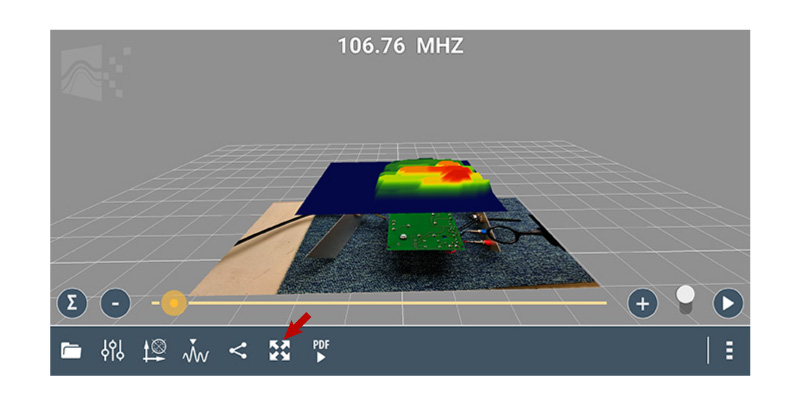
Default view
Reverts to the original point of view, useful to take screenshots from other angles
How to add screenshots to the PDF report

This allows you to take screenshot and add them automatically to your report.